


 Header Through Cloudflare")


Effective monitoring is crucial for maintaining the performance, security, and reliability of Linux servers. This comprehensive guide will delve into the details of setting up a robust monitoring system, configuring automatic alerts, identifying performance bottlenecks, and resolving server issues efficiently. By the end of this article, you’ll be well-equipped to handle server monitoring with confidence and precision.
Understanding Linux Server Monitoring
Server monitoring involves tracking various metrics and system states to ensure that hardware and software are functioning optimally. This proactive approach helps in early detection of issues that could potentially lead to downtimes or security breaches.
Key Metrics to Monitor
- CPU Usage: High CPU usage can indicate inefficient application performance or an unintended background process consuming resources.
- Memory Utilization: Memory leaks or insufficient RAM can slow down processes and lead to system crashes.
- Disk I/O: Monitoring disk reads and writes helps in identifying slow or failing disk drives.
- Network Traffic: Anomalies in inbound or outbound traffic can signal potential security threats or network issues.
- System Load: It indicates the overall burden on the system at a given time and helps in assessing the system’s response time under different loads.
Tools for Monitoring
Several open-source and commercial tools are available for Linux server monitoring. Some of the most popular include:
- Nagios: Highly configurable and capable of monitoring network services, host resources, and server components.
- Zabbix: Offers a comprehensive set of features for network and system monitoring, along with a user-friendly interface.
- Prometheus: Known for its powerful querying language and integration with Grafana for visualizing data.
Command-Line Utilities for Monitoring Load
1. The top Command
The top command is invaluable for a dynamic, real-time overview of the system. It shows system summary information and a list of tasks currently managed by the Linux kernel and other key metrics including CPU, memory usage, and the all-important load averages at the top of its display.
top
Expected Output:
top - 15:00:24 up 10 days,  2:00,  2 users,  load average: 0.85, 0.77, 0.69
Tasks: 193 total,   1 running, 192 sleeping,   0 stopped,   0 zombie
%Cpu(s):  7.8 us,  2.4 sy,  0.0 ni, 89.6 id,  0.1 wa,  0.0 hi,  0.1 si,  0.0 st
MiB Mem :   7976.1 total,   1043.3 free,   4553.5 used,   2379.3 buff/cache
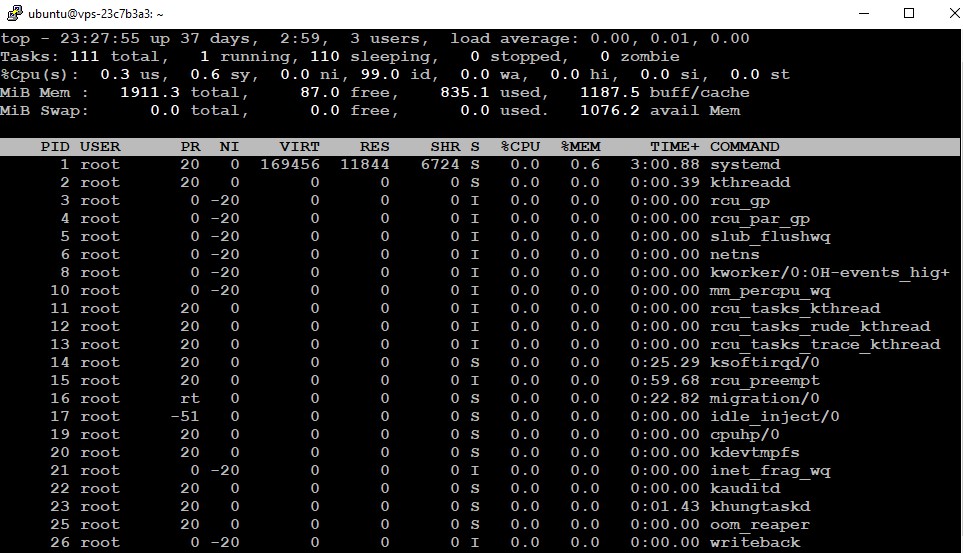
=> Understanding Server Load and Load Averages
Server load is an essential metric that helps administrators identify bottlenecks and potential performance issues. It is quantified by load averages, which represent the average number of processes waiting to run on the CPU. These averages are typically shown over three time intervals: 1-minute, 5-minute, and 15-minute durations. So in the above example, the numbers shown in red are the load averages in the last 1 minute (0.85), the last 5 minutes (0.77), and the 15 minutes (0.69).
- 1-minute average: Indicates immediate load; ideal for real-time monitoring.
- 5-minute average: Provides a medium-term trend, useful for spotting emerging issues.
- 15-minute average: Shows long-term trends, helping in capacity planning and longer-term adjustments.
A load average less than 1.0 per CPU core indicates underutilization, while a value over 1.0 per core suggests that the CPU is overloaded, leading to queued processes.
Press q to exit top.
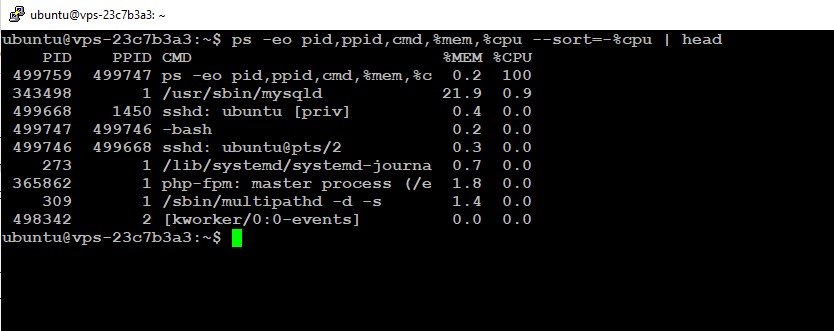
2. The ps Command – Identifying Resource-Heavy Processes
To find out which process is consuming excessive CPU or memory, use:
ps -eo pid,ppid,cmd,%mem,%cpu --sort=-%cpu | head
3. The htop Command
For a more visual and interactive approach, htop provides color-coded displays and extensive customization options, along with similar metrics.
htop
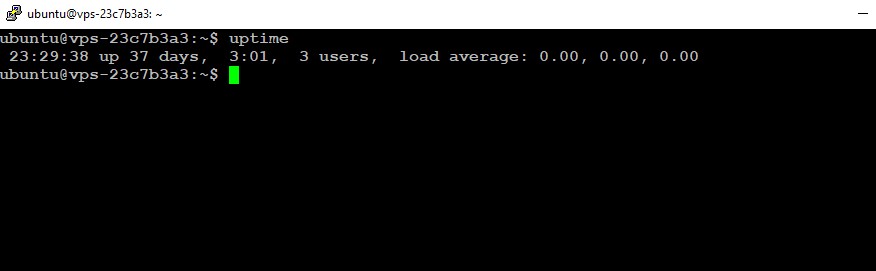
4. The uptime Command
For a quick snapshot of server performance, uptime shows how long the server has been running alongside the load averages for the past 1, 5, and 15 minutes.
uptime
Expected Output:
15:05:03 up 10 days, 2:05, 2 users, load average: 0.85, 0.78, 0.70
For more similar content and to learn Ubuntu Linux Visit our page for Linux learning.
Setting Up Monitoring
Installation of a Monitoring Tool
For continuous monitoring of server load, it’s advisable to set up automated monitoring systems such as Nagios, Zabbix, or Prometheus. These tools offer advanced features for monitoring server performance, generating alerts, and analyzing historical data. Nagios is a popular open-source monitoring tool that can be used to monitor server load, network services, and system metrics. It allows users to define custom checks, set thresholds for alerts, and receive notifications via email or SMS.
For this guide, let’s consider installing Nagios on a Linux server. Nagios offers comprehensive features for continuous monitoring. It can monitor server load, network services, and system metrics. Here’s how to configure it to monitor CPU load:
1. Install Required Packages:
sudo apt update
sudo apt install -y autoconf gcc libc6 make wget unzip apache2 php libapache2-mod-php7.4 libgd-dev
2. Download and Install Nagios:
wget https://assets.nagios.com/downloads/nagioscore/releases/nagios-4.4.6.tar.gz
tar xzf nagios-4.4.6.tar.gz
cd nagios-4.4.6
./configure --with-httpd-conf=/etc/apache2/sites-enabled
make all
sudo make install-groups-users
sudo make install
sudo make install-daemoninit
sudo make install-config
sudo make install-commandmode
sudo make install-webconf
sudo a2enmod rewrite cgi
sudo systemctl restart apache2
Configure Nagios:
Default Location of Nagios Configuration Files
Nagios stores its configuration files in a directory, which is typically located at /usr/local/nagios/etc/ if you’ve compiled Nagios from source. If you installed Nagios from a package manager, the configuration files might be in a different directory like /etc/nagios/.
Inside this directory, you’ll find several key configuration files:
- nagios.cfg – The main configuration file for Nagios.
- objects/ – This directory contains several files where specific objects like hosts, services, commands, time periods, and more are defined. Common files include:
- commands.cfg – Definitions of commands to check services.
- contacts.cfg – Contact information for notifications.
- hostgroups.cfg – Definitions of host groups.
- hosts.cfg – Definitions of individual hosts.
- services.cfg – Service definitions for monitoring.
Editing Nagios Configuration Files
To configure Nagios effectively, you’ll need to edit these files according to your monitoring needs.
1. Configuring Basic Settings in nagios.cfg
Open the nagios.cfg file with your preferred text editor. For example:
sudo nano /usr/local/nagios/etc/nagios.cfg
Here, you can modify basic operational settings, such as:
- log_file: Path to the main log file.
- cfg_dir: Directory where Nagios should read additional configuration files.
- check_external_commands: Enable or disable the processing of external command files.
Make sure to uncomment lines by removing the # at the beginning if you make any changes.
2. Defining Hosts and Services
Go to the objects/ directory and open hosts.cfg:
sudo nano /usr/local/nagios/etc/objects/hosts.cfg
Add a definition for each server or device you want to monitor. Here’s an example of a host definition:
define host{
        use                     linux-server            ; Name of host template to use
        host_name               myserver
        alias                   My Server
        address                 192.168.1.10
        max_check_attempts      5
        check_period            24x7
        notification_interval   30
        notification_period     24x7
    }
Similarly, define services in the services.cfg file. Edit the Nagios configuration files to add hosts and services that you want to monitor.sudo nano /usr/local/nagios/etc/objects/services.cfg
Define service to monitor CPU load: Edit the services.cfg file to include a service definition for CPU load. Here’s an example of a service definition for monitoring HTTP:
define service{
        use                     generic-service
        host_name               myserver
        service_description     HTTP
        check_command           check_http
        max_check_attempts      4
        normal_check_interval   5
        retry_check_interval    1
        check_period            24x7
        notification_interval   30
        notification_period     workhours
    }
3. Configuring Contacts for Notifications
Edit contacts.cfg to define who will receive alerts and how:
sudo nano /usr/local/nagios/etc/objects/contacts.cfg
An example contact configuration:
define contact{
        contact_name                    john_doe
        alias                           John Doe
        service_notification_period     24x7
        host_notification_period        24x7
        service_notification_options    w,u,c,r
        host_notification_options       d,r
        service_notification_commands   notify-service-by-email
        host_notification_commands      notify-host-by-email
        email                           john.doe@example.com
    }
4. Validating Configuration
After making changes, it’s crucial to check for any syntax errors:
sudo /usr/local/nagios/bin/nagios -v /usr/local/nagios/etc/nagios.cfg
This command will validate your configuration files and report any errors, allowing you to fix them before restarting Nagios to apply changes:
sudo systemctl restart nagios
By carefully editing and managing these configuration files, you can tailor Nagios to meet your specific monitoring needs and ensure your Linux servers are under constant and effective surveillance.
Best Practices for Monitoring and Troubleshooting
- Regular Checks: Automate regular checks using cron jobs or monitoring software to catch issues before they escalate.
- Alerting: Configure alerts for critical thresholds to ensure immediate response to potential problems.
- Capacity Planning: Use historical data from tools like Zabbix or Prometheus for informed capacity planning.
Conclusion
Efficient management of Linux server load involves not just the setup of monitoring tools but also a deep understanding of what metrics to watch and how to interpret them. The strategies and tools discussed in this guide provide a robust framework for monitoring and managing server performance, ensuring that your Linux servers run smoothly and continue to meet the demands of your operations.


